The Equation Series
Menu
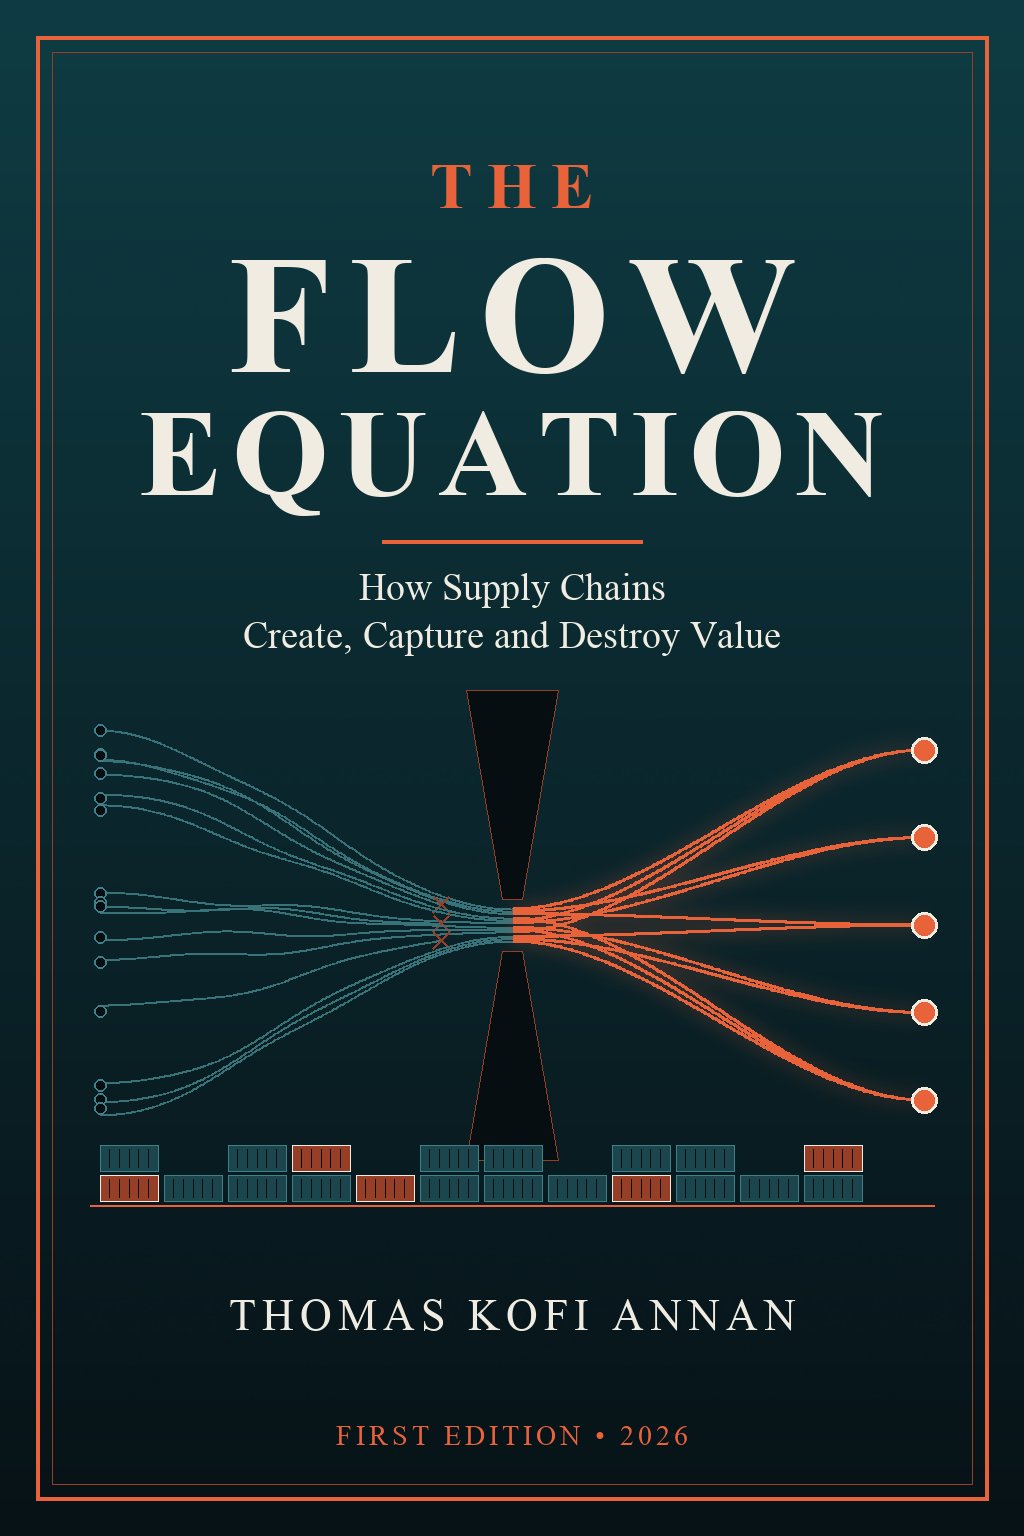
The Flow Equation cover

Supply Chain · Volume 5 of the Equation Series

The Flow Equation

How Supply Chains Create, Capture and Destroy Value

By Thomas Kofi Annan · First edition, 2026

In the first months of 2026 the supply-chain business was reminded, twice, what it sells. On 20 February the Supreme Court ruled six to three, in Learning Resources v. Trump, that the emergency-powers law under which the United States had imposed most of its 2025 tariffs does not authorise tariffs at all. Read more

25
chapters
24
industry studies
100
companies
848
moves

Complete EditionBest value

Everything above, at the best price

PDF + EPUB + M4B

$99

Buy Complete Edition

The Book

25 chapters · ~71,000 words

PDF + EPUB, plus the narrative edition

$29

Buy The Book

Research Companion

24 studies · 100 profiles · 848 moves · ~1.4 million words

PDF + EPUB, plus the narrative edition

$59

Buy Research Companion

Audiobook

154 hr 21 min across 4 volumes

M4B (chaptered)

$39

Buy Audiobook

From the preface

The flow equation

In the first months of 2026 the supply-chain business was reminded, twice, what it sells. On 20 February the Supreme Court ruled six to three, in Learning Resources v. Trump, that the emergency-powers law under which the United States had imposed most of its 2025 tariffs does not authorise tariffs at all. The same day the administration announced a 10% tariff on most imports under Section 122 of the Trade Act of 1974, a stopgap that ran from 24 February to 24 July and was followed by a new Section 301 regime. Importers began to claim refunds of the struck-down duties; Walmart alone reported about $2.9 billion received in one quarter. A week after the ruling, US–Israeli strikes on Iran began a war that effectively halted traffic through the Strait of Hormuz from early March. Freight rates followed: the Drewry World Container Index spot rate from Shanghai to Los Angeles was about $7,514 per forty-foot container at the end of October 2026, against about $2,290 a year earlier, and Maersk doubled the midpoint of its 2026 earnings guidance between February and August. Companies with customs expertise, inventory already on American soil or ships away from the Gulf were suddenly worth more than companies with cheaper factories.

The difference is rarely the quality of the ships, trucks, warehouses or software. This book argues that a supply-chain business creates durable value only when four things are true at once, and that the factors multiply rather than add: if any is zero, the result is zero. It must have a cost to serve below what the customer will pay across the freight cycle, not just at its peak, counting empty miles, idle capacity, returns, claims and the inventory carried along the way. It must have density, enough volume on the right lanes and through the right nodes that its fixed assets run full and each extra shipment costs less than the last. It must have reliability, a promise customers can plan around, on time, in full, undamaged and visible, kept in an ordinary week and in a disruption. And it must have capital matched to the cycle, balance sheets, leases, charters and working capital that survive the trough of the freight cycle and the swing of the inventory cycle. Around those four factors sit two forces that no company controls, the freight cycle, with its booms and busts amplified along the chain by the bullwhip, and shocks and trade politics, from pandemics, canal blockages, wars, strikes and cyberattacks to tariffs and customs rules. They behave like weather: they do not decide whether a business is sound, but they decide how long an unsound one survives, and they can bankrupt a sound one financed for fair weather only. Most of the failures in this book come from treating one factor as proven because another was: a boom-year rate mistaken for cost to serve, venture money mistaken for density, a tariff exemption mistaken for a supply chain, a cheap supplier mistaken for a reliable one.

The twenty-five chapters develop that view in seven parts. Part I explains why supply chains are not just logistics, how moving goods became a business from the railroads to the container, Toyota, Walmart and e-commerce, who pays to move a box, and why inventory, service and revenue figures need definitions before they can be trusted. Part II follows the networks one by one: ocean shipping and ports, trucking and the freight cycle, rail and intermodal, parcel and the last mile, air cargo and express, warehousing and automation, and software and data. Part III examines what it takes to build things that work: cost to serve and network design, contracts and the freight market, inventory and the bullwhip, sourcing and supplier power, retail supply chains, and reliability and safety. Part IV covers capital cycles, tariffs and customs, chokepoints and resilience, nearshoring and the new map of trade, and supply chains around the world. Part V turns to people: leadership, labour and culture, and how to build a supply-chain company. Part VI reads five cases for the decisions behind them, and the Practical Reference supplies worked examples, checklists, a glossary and a guide to the evidence. Each chapter opens with a documented case, explains the mechanics it illustrates, works one stylized example and closes by naming the factor of the equation on which its case turned.

The book · ~71,000 words

Contents

Each chapter has a free preview of its opening and section list.

Supply Chain Research Companion · Part I

24 industry studies

The companion opens with an in-depth study of each part of the industry, backed by 22 technical exhibits: worked examples, diligence checklists and case studies.

01Ocean Container Shipping and Carrier AlliancesThe steel box is the most important piece of equipment in the world economy, and the business of carrying it is the most cyclical one in this knowledge base. Since Malcom McLean's *Ideal X* sailed from Newark to Houston on 26 Apr 1956, the container has cut the cost of moving a manufactured good across an ocean to a few cents or a few dollars per item, and in doing so made global sourcing possible. But the carriers that move the boxes sell a nearly undifferentiated service with very high fixed costs, so prices swing violently with the balance of ships and cargo. In 2021–22 a pandemic demand surge and port congestion took spot rates to roughly five to ten times their pre-pandemic levels and gave the liner industry the largest profits in its history; by 2023 rates had fallen back towards cost; then the Houthi attacks in the Red Sea (from Nov 2023) sent most Asia–Europe ships around the Cape of Good Hope, absorbing capacity and lifting rates again through 2024. In 2026 the industry is pulled between two forces: a record orderbook (~16.2m TEU, ~46.5% of the existing fleet, Linerlytica via Seatrade, Oct 2026, reported) and recurring shocks that soak up ships (the slow, stop-start return to Suez and the 2026 Hormuz crisis). Drewry's World Container Index stood at ~$4,429/FEU on 29 Oct 2026, with Shanghai–Los Angeles ~$7,514/FEU and Shanghai–New York ~$9,631/FEU (single secondary source; verify against Drewry). This section explains the container's economics, ship sizes and the orderbook, slot costs and utilisation, alliances (the end of 2M, Gemini, Ocean and Premier), contract and spot pricing, the 2021–22 boom, overcapacity, bunker fuel and the IMO rules, and the Jones Act. A companion file works through a ship's voyage economics via Suez versus the Cape; a second gives a shipper's checklist for ocean contracts and alliance choice.+ 2 exhibits02Ports, Terminals, Canals and Maritime InfrastructureA container ship is only as useful as the places it can call at, and the places it must pass through. Ports, terminals and canals are the fixed nodes and gates of the ocean network: expensive, long-lived, mostly local monopolies or duopolies, often state-owned or state-influenced, and run by a small group of global terminal operators (PSA, Hutchison Ports, APM Terminals, DP World, COSCO Shipping Ports, MSC's Terminal Investment Ltd and CMA CGM's terminals). Their business is the opposite of the carriers' in one important way: a terminal earns on throughput, not freight rates, under concessions of 20–50 years, so it is steadier through the freight cycle than the ships that call at it. But it lives or dies on reliability and labour. When the terminals at Los Angeles and Long Beach could not clear boxes fast enough in 2021, the queue offshore reached ~100 ships (peak ~109 on 9 Jan 2022, Marine Exchange of Southern California count, reported; verify) and rates on Asia–US West Coast lanes rose more than tenfold from pre-pandemic levels; when the International Longshoremen's Association struck 36 East and Gulf Coast ports on 1–3 Oct 2024, a six-year master contract followed, ratified on 25 Feb 2025 with ~99% support, a reported ~62% wage increase and strong automation protections through 30 Sep 2030 (ILA and trade press). Canals are the other half of the story. The Panama Canal cut transits during the 2023–24 drought and then recovered: 13,951 transits in fiscal 2026 (Oct 2025–Sep 2026), up 4.1%, a record ~521m PC/UMS tons and ~B/.6.6bn of revenue (Panama Canal Authority preliminary figures, 21 Oct 2026, reported). The Suez Canal lost most of its container traffic to the Red Sea diversions from Dec 2023: revenue fell from a record ~$9.4bn (FY2022/23) to ~$4bn a year, recovering only to ~$4.6bn in FY2025/26 (to 30 Jun 2026, +23%, Suez Canal Authority chairman, reported). And ports became geopolitics: COSCO at Piraeus and Hamburg, the US port fees on Chinese-built ships (in force 14 Oct 2025, suspended from 10 Nov 2025), and Hutchison's Panama terminals, whose concession Panama's Supreme Court annulled in late Jan 2026 before the state took them over in late Feb 2026 (reported). This section explains how ports and terminals make money, landlord versus operating ports, the terminal-operator industry, labour and automation, congestion, the canals, US port infrastructure (Baltimore after the Key Bridge collapse), and state ownership. It has no worked example; Red Sea diversion economics are worked in 01 and 22.03Air Cargo and ExpressAir cargo carries a tiny share of world trade by weight and a large share by value: well under 1% of tonnage but roughly a third of the value of goods traded across borders (IATA's commonly cited estimate; verify the current figure). It is the mode for things that are urgent, perishable, valuable or small — semiconductors and AI servers, pharmaceuticals, fresh flowers and seafood, spare parts, fashion, and above all, in 2018–25, e-commerce parcels from China. The industry has two halves with different economics. Integrators — FedEx, UPS and DHL, plus Amazon Air as a private network — sell a door-to-door, time-definite product built on their own aircraft and hubs (Memphis, Louisville, Leipzig, Cincinnati), and earn their money from network density and reliability. General air cargo is a wholesale market: combination airlines sell space in passenger aircraft bellies and freighters, and all-cargo and ACMI operators (Atlas Air, Cargolux, Kalitta) sell freighter capacity, mostly to freight forwarders, at rates that swing violently with the balance of capacity and demand. That swing was most extreme in 2020–21, when grounded passenger fleets removed roughly half of global capacity and rates on the Hong Kong–North America lane rose above ~$10/kg (TAC Index / Baltic Air Freight Index, late 2021, reported; verify peak), handing airlines record cargo revenues. The next shock came from US trade policy: low-value e-commerce was ~55% of China–US air volumes in 2024 (~1.2m tonnes, Aevean, reported), and when the US ended the de minimis exemption for China and Hong Kong on 2 May 2025 (and suspended it for all countries on 29 Aug 2025), transpacific freighter capacity fell by ~40 daily flights at the May 2025 low (Rotate, reported). This section explains capacity (belly vs freighter), the integrators' hub-and-spoke model, ACMI, the e-commerce boom and its end, rates and units, the 2020–21 spike, and the business's exposure to fuel and geopolitics.04Trucking: Truckload, LTL and the Freight CycleTrucks move roughly 70% of US freight by weight and a larger share by value (American Trucking Associations and Bureau of Transportation Statistics series; verify the latest year), and trucking is where the freight cycle is felt first and hardest. It is two businesses that share a highway. Truckload (TL) — one shipper's freight filling a trailer from A to B — is one of the most fragmented markets in the US economy: hundreds of thousands of for-hire carriers, most with a handful of trucks, entering in booms and exiting in busts, with no network and little pricing power. Less-than-truckload (LTL) — many shippers' pallets consolidated through terminal networks — is a concentrated, high-barrier network business where density and reliability compound: Old Dominion reported an operating ratio of 71.5% in Q3 2026 (vs 74.3% a year earlier) on flat tonnage (company 8-K, 28 Oct 2026, reported), while Yellow, with a network of similar size, stopped operating on 30 Jul 2023. After the 2021 boom, truckload went through the longest freight recession in modern records (2022–25): capacity added at the peak took three years to leave. In 2026 the market turned on the supply side rather than demand: the Cass Truckload Linehaul Index rose to 154.8 in Sep 2026, +10.1% y/y, its 21st straight month of y/y growth, while Cass shipments rose only 1.9% y/y (the second y/y increase after 42 months of declines) (Cass via FreightWaves, reported). Federal enforcement of English-language proficiency (out-of-service since 25 Jun 2025) and the non-domiciled CDL final rule (in force 16 Mar 2026) removed drivers, and the 2026 diesel shock (Cass reported diesel up ~68% y/y in Sep 2026) raised costs. DAT reported national dry van spot linehaul of ~$2.26/mile (all-in with fuel ~$3.09/mile) in mid-Oct 2026. This section explains TL and LTL economics, operating ratio, density and terminals, the carrier base and owner-operators, drivers, spot and contract pricing, the cycle since 2018, Yellow, regulation, and autonomous trucks. Two companion files work through an owner-operator's cost per mile across the cycle and give a shipper's TL and LTL procurement checklist.+ 2 exhibits05Rail and IntermodalNorth American freight railroads are among the most profitable transport businesses in the world and among the least loved by their customers. Six Class I railroads — BNSF, Union Pacific, CSX, Norfolk Southern, Canadian National and CPKC — own their tracks, face little direct competition on many routes, and since the Staggers Rail Act of 1980 have been free to set most rates. Rail carries a large share of US long-distance freight ton-miles (roughly a quarter to two-fifths depending on the measure, BTS and AAR; verify the current figure) at a fraction of trucking's fuel and labour per ton-mile. From 2017, precision scheduled railroading (PSR) — Hunter Harrison's operating model, imposed at CSX in March 2017 and copied by most of the industry — drove operating ratios from the high 60s into the high 50s and low 60s: Union Pacific reported 59.8% for 2025 (adjusted 59.3%) on ~$24.5bn of revenue and ~$7.1bn of net income (company, 27 Jan 2026). Customers and regulators argued the cost was service, workforce and safety: the 2021–22 service crisis, the near-strike of 2022 settled by Congress, and Norfolk Southern's East Palestine derailment of 3 Feb 2023. Intermodal — containers and trailers moved by rail between trucks at each end — is rail's growth business and its most cyclical, competing head-on with trucking (04). The industry is now in the middle of its biggest structural change in a generation: CPKC (Canadian Pacific–Kansas City Southern, combined Apr 2023) created the first single-line railroad linking Canada, the US and Mexico, and Union Pacific–Norfolk Southern (announced Jul 2025, ~$85bn reported; STB docket FD 36873) would create the first US coast-to-coast railroad if approved. This section explains Class I economics and pricing power, PSR and its costs, intermodal partnerships, STB regulation and merger rules, the two mergers, East Palestine, rail labour, and Europe's contrasting model.06Parcel, Postal and the Last MileParcel delivery is the most visible part of the supply chain and the one whose economics are least understood by the people who use it. A parcel network is a machine of fixed costs — hubs, sort centres, aircraft, vans, drivers paid by the hour — that becomes profitable only when enough pieces flow through it, on enough routes, with enough pieces at each stop. Density is the product. The US market moved roughly 22–23 billion parcels a year in 2023–24 (Pitney Bowes Parcel Shipping Index, reported; the 2025 edition said growth slowed to ~0.4% year on year in Q1 2025 and forecast a most-likely ~30.5 billion by 2029). Its structure changed more in 2019–26 than in the previous forty years: Amazon Logistics built a private network that by the 2025 Pitney Bowes report had become the largest US parcel carrier by volume (~6.9 billion parcels, reported, 2024 data); FedEx ended its Amazon contracts in 2019 and merged Express and Ground into one network; UPS decided in 2025 to cut its Amazon volume roughly in half by mid-2026, closing dozens of buildings and cutting tens of thousands of jobs; and the US Postal Service — the carrier of last resort to every address — reported a net loss of ~$9.0bn in fiscal 2025 on ~$80.5bn of operating revenue and hit its $15bn Treasury borrowing limit (USPS, Nov 2025; congressional letter, Jun 2026). Europe ran a different experiment: lockers. Poland's InPost turned the parcel locker into a density machine, and in February 2026 a consortium of Advent and FedEx agreed to buy it for €15.60 a share (~€7.8bn). The quick-commerce boom of 2020–22 (Getir, Gorillas, Gopuff) showed the other side: speed bought with venture money and no density. This section explains how a parcel network makes money, the US share shifts, regional carriers and gig models, lockers, quick commerce, surcharges and returns. Two companion files work through a stylized route-density model and give a parcel-contract review checklist.+ 2 exhibits07Freight Forwarding, Customs Brokerage and Contract LogisticsMost of the world's freight is bought not from the ship, plane or truck that carries it but from an intermediary who arranges it: a freight forwarder that books space with carriers, consolidates shipments, prepares documents, clears customs and delivers to the door; a customs broker licensed to file entries and pay duties on the importer's behalf; or a contract-logistics provider (a "3PL") that runs warehouses and transport under multi-year contracts. These are asset-light businesses whose reported revenue is mostly someone else's: a forwarder's "revenue" includes the ocean and air freight it buys and resells, so in a rate boom revenue balloons while the forwarder's own earnings — its gross profit or net revenue after purchased transportation — rise far less. C.H. Robinson's Global Forwarding segment shows the gap in one quarter: Q3 2026 revenue of ~$1.15bn (+46% y/y) against adjusted gross profit of ~$221m (+15%) (company 8-K, 28 Oct 2026). The industry consolidated sharply: DSV, built by acquisitions since 1976, bought DB Schenker for ~€14.3bn (closed 30 Apr 2025, reported) and reported 2025 revenue of ~DKK 247bn, gross profit ~DKK 67bn and EBIT before special items ~DKK 19.6bn (company, reported), with Schenker integration to be completed by end-2026; Kuehne+Nagel, the largest sea forwarder, reported 2025 net turnover of ~CHF 24.5bn, EBIT of ~CHF 1.4bn and earnings down ~25% to ~CHF 925m, and launched a ~CHF 200m cost programme (reported). The forwarders' 2021–22 windfall, when congestion made space scarce and margins per container soared, was followed by a 2023–25 normalisation. Customs brokerage became the industry's growth engine in 2025–26 as US tariff authorities changed four times — IEEPA tariffs (2025), struck down on 20 Feb 2026; Section 122 (24 Feb–24 Jul 2026); a new Section 301 regime (from 24 Jul 2026) — with IEEPA refunds ordered by the Court of International Trade from Mar 2026 and de minimis suspended for all countries since 29 Aug 2025. Contract logistics (DHL Supply Chain, GXO, Ryder, CEVA and others) is a different business: labour-intensive warehouse operations whose risk is a lease that outlives the contract. This section explains how forwarders, NVOCCs, customs brokers and 3PLs make money, gross versus net revenue, licensing (CBP, FMC, IATA), consolidation, technology and the tariff-era boom.08Freight Brokerage and Digital Freight PlatformsUS trucking is the most fragmented large freight market in the world — hundreds of thousands of carriers, most running fewer than ten trucks — and the freight broker is the market-maker that connects it to shippers. A broker owns no trucks: it wins a load from a shipper, finds a carrier to haul it, pays the carrier less than it charges the shipper, and keeps the spread (its gross margin, or net revenue). Brokers therefore report large gross revenue that is mostly the carriers' money: C.H. Robinson's North American Surface Transportation segment reported Q3 2026 revenue of ~$3.83bn but adjusted gross profit of ~$518m (company 8-K, 28 Oct 2026). Brokerage margins move against the spot market: when spot truckload rates fall below the contract rates brokers have agreed with shippers (2019, 2022–25), margins widen; when spot spikes above contract (2018, 2021, and the supply-driven tightening of 2026), margins compress — unless the broker reprices, as C.H. Robinson did in 2026, lifting truckload adjusted gross profit per shipment ~17% y/y while average headcount fell ~10% (company). The 2017–22 digital-freight boom poured billions of venture dollars into app-based brokers promising to replace the phone and the broker rep with algorithms; most failed or retreated when the freight recession arrived — Convoy, once valued at ~$3.8bn (2022, reported), shut down on 19 Oct 2023; Transfix sold its brokerage operations (2024, reported; verify); Uber Freight survived by buying the managed-transportation firm Transplace (2021, ~$2.25bn). Incumbents absorbed the technology instead, and from 2023 the frontier moved to AI agents that quote, book, track and collect. The industry's other story is fraud: identity theft of carrier authority, double brokering and fictitious pickups rose sharply in 2022–26, while FMCSA told Congress it lacked data even to measure double brokering and asked for authority to fine unauthorised brokers (reported). This section explains the broker's model, gross versus net revenue, margins through the cycle, the main brokers (C.H. Robinson, TQL, RXO, Landstar's agent model), digital freight's rise and fall, load boards, fraud and regulation, liability and AI. It has no worked example: the arithmetic of one broker's per-load economics and working capital is worked in Appendix A.4 of the main book, and an owner-operator's cost per mile through the cycle — the other side of the broker's spread — in 04.09Warehousing, Fulfilment and Industrial Real EstateA warehouse is where a supply chain stops moving, and every hour that goods sit still costs rent, labour, power, insurance and the interest on the inventory itself. For most of the twentieth century warehouses were cheap boxes at the edge of town. E-commerce changed that: an online order needs several times the warehouse space of the same sale through a store, buildings moved closer to customers, and between 2020 and 2022 US industrial vacancy fell to record lows of roughly 3–4% while asking rents rose by double digits a year (Cushman & Wakefield, CBRE and other brokers, reported; exact lows vary by source). Developers answered with the largest construction wave on record, Amazon announced in 2022 that it had built more space than it needed, and vacancy roughly doubled to ~7% by 2024–25 as the new supply landed. By the third quarter of 2026 the cycle had turned again: Cushman & Wakefield put national vacancy at ~6.8% with ~76.6m sq ft of net absorption in the quarter, the strongest since early 2023, and annual asking-rent growth of ~4% (Q3 2026 MarketBeat, as reported by trade press; CBRE counted ~104.6m sq ft of absorption, a different methodology). JLL's Q2 2026 national asking rent was ~$10.45 per sq ft a year (reported). The industry's landlord, Prologis, reported ~95–96% occupancy in Q3 2026 and a data-centre pipeline of ~5.8 GW (reported), a sign that the same land, power and permits that serve logistics are now contested by AI computing. This section explains warehouse types and what drives their cost, the industrial real-estate market and its cycle, Amazon's build-out and pullback, the third-party warehousing (3PL) business, labour, power and land, and how to read the numbers. Two companion files give a worked example of leasing versus building a distribution centre and a checklist for choosing and leasing one.+ 2 exhibits10Warehouse Automation, Robotics and Autonomous TruckingLabour is the largest controllable cost in a warehouse and the driver is the largest cost of a truck, so the oldest promise in logistics is a machine that removes them. In warehouses the promise is now real at scale: Amazon Logistics, which bought Kiva Systems for ~$775m in March 2012, said in July 2025 that it had deployed its one-millionth robot, against ~1.56m employees at the end of 2024, and introduced an AI model (DeepFleet) that it said cut robot fleet travel time by ~10% (company, reported). Symbotic, which automates Walmart's regional distribution centres, reported fiscal Q3 2026 revenue of ~$721m (+~22% y/y) and a backlog of ~$22.5bn (August 2026, reported), most of it from one customer. But automation has also produced some of the industry's costliest mistakes: SPAC-era robotics companies that collapsed, grocery fulfilment centres that never reached the volumes they were built for (Kroger said in November 2025 it would close three Ocado-equipped sites and take an impairment of ~$2.6bn; Ocado later said it would receive ~$350m in compensation, reported; see Ocado), and a patent war between Ocado and AutoStore settled in 2023. On the road, Aurora Innovation began carrying freight without a driver between Dallas and Houston on 1 May 2025 (some reports say late April), then put an observer back in the cab within three weeks at truck-maker Paccar's request; by Q3 2026 it reported ~$3m of quarterly revenue, a ~$234m net loss and a target of ~200 driverless trucks by end-February 2027 (company, reported). TuSimple, once the sector's listed leader, left the US business and renamed itself CreateAI in 2024. This section explains the automation technologies and their economics, who builds and buys them, why projects fail, how autonomous trucking works as a business, and what automation does to labour. Two companion files size an autonomous-mobile-robot fleet for peak demand and give an automation and autonomy diligence checklist.+ 2 exhibits11Inventory Planning, Forecasting and the BullwhipInventory is the supply chain's shock absorber and its most expensive mistake. Every company holds it for the same reasons (factories run in batches, ships take weeks, customers want things now) and every company pays for it the same way: in cash tied up, in warehouse space, in obsolescence and markdowns, and in interest, typically adding up to ~20–30% of the inventory's value a year on common rules of thumb (verify for any business). The amount the US economy holds relative to its sales moves with the cycle: the Census Bureau's total business inventories-to-sales ratio fell to unusually low levels in 2021 as demand outran supply (around ~1.25 in mid-2021; verify), rebuilt through 2022–23, and stood at ~1.33 in August 2026, down from ~1.40 a year earlier (Census release of 15 Oct 2026, reported), as companies that had stockpiled ahead of the 2025 tariffs worked the stock down. The pandemic years showed the bullwhip effect at national scale: small changes in what consumers bought turned into much larger swings in what retailers ordered from wholesalers, what wholesalers ordered from factories and what factories ordered from their suppliers. Shortages in 2021 became gluts in 2022: Target warned in June 2022 that it would cut prices and cancel orders to clear excess inventory, Walmart and Nike reported inventories up by a third or more year on year, and Peloton went from waiting lists to write-downs within a year. This section explains how inventory is measured and planned, how forecasts are made and judged, why the bullwhip happens and how to damp it, the 2020–23 shortage-to-glut cycle, just-in-time against just-in-case, and inventory as working capital. Two companion files give a four-tier bullwhip simulation and an inventory-health review checklist.+ 2 exhibits12Procurement, Sourcing and Supplier RiskMost companies that make or sell physical goods spend more than half of their revenue buying things from other companies, so procurement decides much of their cost to serve and much of their risk. A manufacturer's purchased materials and services are commonly 50–70% of its cost of goods; a retailer's purchases from suppliers are most of its cost of sales. For decades procurement was run as a price-negotiation function, measured on "savings" against last year's price. The 2020–22 shortages, the 2025–26 tariff sequence and a wave of forced-labour and due-diligence laws turned it into a risk function as well: buyers discovered that the cheapest supplier could be a single plant, in one country, using an input from a region whose goods the US presumes to be made with forced labour. The Uyghur Forced Labor Prevention Act's rebuttable presumption has applied since 21 Jun 2022; by Aug 2025 the UFLPA Entity List named ~144 entities, and CBP detained ~6,636 shipments under the law in the first half of 2025, more than the ~4,619 it detained in all of 2024 (DHS strategy update and CBP data via law-firm summaries, reported; check the CBP dashboard). In Europe the Corporate Sustainability Due Diligence Directive was cut back by the Omnibus I directive (Directive (EU) 2026/470, in force 18 Mar 2026): it now covers only companies with more than 5,000 employees and €1.5bn of turnover, from 26 Jul 2029 (law-firm alerts, reported). This section explains strategic sourcing and the category matrix, total cost of ownership and should-cost, supplier concentration and multi-sourcing (with failures from Toyota's 1997 Aisin fire to Abbott's 2022 infant-formula plant closure), buyer power and its limits (Walmart–P&G, Tesco's 2014 supplier-income scandal), procurement and supplier-risk software (SAP Ariba, Coupa), sourcing agents (Li & Fung), forced-labour and due-diligence rules in the US and Europe, contract clauses for tariffs and refunds, and how an experienced chief procurement officer thinks.13Contract Manufacturing, Electronics and Strategic Supply ChainsMost of the world's phones, laptops, servers, game consoles and network switches are not made by the companies whose names are on them. They are designed by brand owners and built by contract manufacturers — electronics manufacturing services (EMS) firms and original design manufacturers (ODMs) such as Foxconn (Hon Hai), Luxshare, Jabil, Flex, Pegatron, Quanta, Wistron and Celestica — that run enormous factories on single-digit operating margins. The model gives brands capital-light scale and gives manufacturers volume, but it concentrates risk: when workers at Foxconn's Zhengzhou iPhone plant protested and left in Nov 2022, Apple warned that iPhone 14 Pro shipments would be lower than expected. Behind the assembly lines sit two strategic supply chains that governments now treat as matters of national security: semiconductors (designed mostly in the US, fabricated mostly by TSMC in Taiwan, governed by US export controls since Oct 2022 and by a 25% Section 232 tariff on specified advanced computing chips from 15 Jan 2026) and critical minerals (mined widely but processed mostly in China, which imposed rare-earth export licensing on 4 Apr 2025 and a much broader package on 9 Oct 2025 before a one-year truce agreed at Busan on 30 Oct 2025). The 2020–23 chip shortage showed what happens when the buyer forgets those chains: carmakers that cancelled orders in spring 2020 lost millions of vehicles of production for lack of chips costing a few dollars, and in Oct 2025 the Nexperia dispute halted Honda's line in Mexico within weeks (reported). This section explains EMS and ODM economics, Apple's model of control without ownership, Dell's build-to-order model, customer concentration, the shift of contract manufacturers into AI servers, the chip shortage from the buyer's side, and the strategic supply chains — summarising and linking the detailed treatments in AI 01 Semiconductors, AI 20 Geopolitics and Export Controls and Energy 20 Critical Minerals rather than repeating them.14Nearshoring, Friend-shoring and China+1For two decades the cheapest answer to "where should we make it?" was nearly always China, and from 2009 China was the largest single source of US goods imports, peaking at ~21.6% of them in 2017 (Congressional Research Service, reported). Since 2018 the answer has been rewritten by tariffs, a pandemic, a container-rate spike, forced-labour rules and wars. Section 301 duties on most Chinese goods (2018–19), the 2021–22 freight shock, the Uyghur Forced Labor Prevention Act (presumption in force 21 Jun 2022) and the 2025–26 tariff sequence turned "China+1" from a hedge into a board-level programme. The trade data moved: Mexico overtook China as the largest source of US goods imports in 2023, supplied ~15.5% of them in 2024 and ranked first again in 2025 (CRS, reported), while China's share fell to ~9.4% in January–July 2025 and ~6.6% in January–February 2026 (Mexico News Daily on US data, reported; bases differ by source, verify against Census). Vietnam, India, Taiwan, Thailand and Malaysia gained too; Apple said most iPhones sold in the US in the June 2025 quarter would come from India. But much of the shift is re-routing rather than replacement: Chinese components and Chinese-owned factories moved into Vietnam, Mexico and Southeast Asia, which is why US policy turned to origin rules, transshipment enforcement and, in 2026, a broad Section 301 regime that taxes most trading partners (10% or 12.5% from 24 Jul 2026, reported, verify), and why Mexico itself raised tariffs of up to 50% on ~1,400 product lines from non-treaty countries such as China from 1 Jan 2026 (reported). The rules that make Mexico attractive are also less certain than they were: at the first USMCA joint review on 1 Jul 2026 the US declined to confirm a 16-year extension, which triggers annual reviews while the agreement stays in force to 2036 (law-firm alerts, reported). This section explains why companies move production, the destinations one by one (Vietnam, India, Mexico, Southeast Asia, Eastern Europe and North Africa for Europe), USMCA and rules of origin, transshipment and origin enforcement, what the trade data do and do not show, the infrastructure (CPKC, border crossings, Monterrey's industrial parks, power and water), the real cost of a move (tooling, ramp-up, yield, duplicate inventory, management time) and how an experienced operator decides. Two companion files give a worked example of the NPV of moving a whole product line to Mexico and a nearshoring and origin-enforcement checklist.+ 2 exhibits15Retail and Consumer Goods Supply ChainsA store-based retailer is a supply chain with a shop at the end of it. Its gross margin is decided by buying; its operating margin is decided by how cheaply and reliably goods move from a factory to a shelf (and, increasingly, from a shelf to a doorstep), and by how little inventory it has to carry to do it. The US leaders show the range of answers. Walmart built the lowest cost to serve in American retail from dense clusters of stores around its own distribution centres, a private truck fleet and data shared with suppliers — the Walmart–Procter & Gamble partnership of 1987 turned replenishment into a joint process and became the template for vendor-managed inventory. Costco carries roughly ~4,000 SKUs (company figure) against tens of thousands in a supercenter, caps markups at ~14% (15% on Kirkland Signature), and sells most of its inventory before it has paid for it. Target shows the failure and the fix: its Canadian expansion collapsed in under two years (2013–Jan 2015) on bad item data and empty shelves, and on 7 June 2022 it cut its profit outlook to clear excess inventory that the post-pandemic demand shift had left on its books — then rebuilt around stores as fulfilment nodes. Home Depot is turning from a store replenisher into a delivery network for professional contractors, buying SRS Distribution in 2024 (~$18.25bn, reported). In Europe, Inditex sources much of its fashion close to Spain and ships twice a week to every store, reporting record sales of ~€39.9bn and net profit of ~€6.2bn in fiscal 2025 (year to 31 Jan 2026; company, reported), while H&M's far-sourced volume model left it with ~$4.3bn of unsold inventory in early 2018 (reported). The discounters Lidl and Aldi run on limited assortment and private label; Tesco's 2014 accounting scandal (~£263m of overstated supplier income, reported) shows where buyer power ends. Behind the shelf, food-service distributors such as Sysco run a parallel network to restaurants and institutions. Since 2018 every one of these chains has also become a tariff manager: Section 301 duties on Chinese goods (2018–19), IEEPA tariffs (2025, struck down 20 Feb 2026), the 10% Section 122 tariff (24 Feb–24 Jul 2026) and the new Section 301 regime from 24 Jul 2026 (reported, verify) changed landed costs four times in two years. This section explains how retail networks are built and paid for, the retailer–supplier relationship, private label, fast fashion, grocery and food service, the store as a fulfilment node, shrink, and how retailers absorb tariffs and inventory cycles.16E-commerce Marketplaces and Cross-Border Direct-to-ConsumerE-commerce moved the last step of retail's supply chain — the trip from the shelf to the home — onto the seller, and turned it into a parcel. Whoever does that cheaply and reliably at scale earns a moat; whoever subsidises it without density loses money on every order. Amazon is the reference case: after carriers failed to deliver its Christmas 2013 parcels on time, it built its own sortation, air, van and delivery-partner network, and it sells that network to third-party sellers through Fulfillment by Amazon (FBA, 2006), whose fees it keeps changing (a restructuring of inbound placement fees from 15 Jan 2026 and a 3.5% fuel and logistics surcharge on FBA fulfilment fees from 17 Apr 2026, per seller-service trackers; verify against Amazon's rate cards). Shopify tried to build a fulfilment network for its merchants, bought Deliverr (2022, ~$2.1bn), and sold its logistics business to Flexport in 2023 for an equity stake — the clearest case of a platform deciding it should not own the supply chain. A different model grew from China: Shein's on-demand production in very small batches, and Temu's "fully managed" marketplace (launched Sep 2022), both shipping individual parcels by air to US consumers duty-free under the $800 de minimis exemption — until it ended for China and Hong Kong on 2 May 2025 and was suspended for all countries on 29 Aug 2025, a suspension kept after the Supreme Court's 20 Feb 2026 IEEPA ruling, written into CBP interim final rules on 24 Jun 2026 and upheld by the CIT on 13 Aug 2026 (Shared facts). Temu stopped China-direct shipments to US buyers and shifted to locally stocked sellers (reported, May 2025); Shein listed in Hong Kong on 1 Sep 2026, raising ~US$1.7bn at HK$48.56 a share and falling as much as ~10% on its debut at a valuation reported at ~$25bn, against a ~$100bn peak in 2022 (reported). Outside the US and China, Coupang (South Korea) and Mercado Libre (Latin America) show marketplaces that won by building the network first. This section explains marketplace economics (GMV vs revenue), Amazon's fulfilment model and fees, the platform's choice between owning and orchestrating logistics, cross-border direct-to-consumer and the de minimis channel, Chinese logistics champions, Europe's rules, and returns.17Supply-Chain Software: ERP, Planning, TMS, WMS and VisibilityEvery container, pallet and parcel in this knowledge base moves twice: once physically and once as data. The data move comes first: a purchase order in an enterprise resource planning (ERP) system, a forecast and replenishment plan in a planning tool, a load tendered through a transportation management system (TMS), a putaway and pick in a warehouse management system (WMS), an entry filed through customs software, and a stream of location pings from telematics and visibility platforms. Software rarely creates a supply chain's advantage by itself, but it decides whether the physical network can run at the density and reliability the business needs, and it is where some of the industry's costliest failures began. Hershey's ERP go-live in Jul 1999 left it unable to ship much of its Halloween candy; Lidl abandoned a seven-year SAP project in 2018 after a reported ~€500m; Target's Canadian stores (opened 2013, closed by Jan 2015) failed partly on bad item data. Software is also a single point of failure: NotPetya shut Maersk's systems in Jun 2017 (cost ~$250–300m, company estimate); Expeditors shut its global systems after a cyberattack in Feb 2022; and a ransomware attack on Blue Yonder on 21 Nov 2024 (claimed by the "Termite" group, which said it took ~680 GB of data) disrupted Starbucks's scheduling across more than 10,000 US stores and Morrisons's fresh-food warehouse systems in the UK (reported). The listed fleet-software leader, Samsara, reported fiscal-2026 revenue of ~$1.62bn (+30%) and annual recurring revenue of ~$1.89bn (year to 31 Jan 2026; company 8-K, 5 Mar 2026) with a small GAAP operating loss (~$53m) and two consecutive GAAP-profitable quarters. This section explains the software stack, ERP and planning, execution systems, visibility and data networks, fleet IoT, procurement SaaS, the economics of selling software to supply chains, implementation failures, cyber risk and what AI does and does not change.18Trade Finance, Payments and Working CapitalEvery physical supply chain has a financial one running beside it, usually in the opposite direction and on a different clock. Goods leave a factory in Vietnam or Mexico weeks before they are sold in Ohio; someone has to fund the gap, and someone bears the risk that the buyer will not pay or the goods will not arrive. The instruments are old — letters of credit (governed today by the ICC's UCP 600, in force since 1 Jul 2007), documentary collections and open-account terms — and most trade between established partners now moves on open account (commonly cited at ~80% of world trade, verify), financed by the seller, the buyer, a bank or a platform in between. The modern growth area is supply-chain finance (SCF), above all payables finance or "reverse factoring": a bank or fintech pays a large buyer's suppliers early at a rate set by the *buyer's* credit, while the buyer pays the funder later. One industry report put global SCF volumes at ~$2.6tn in 2025 (+~7.5% y/y; BCR *World Supply Chain Finance Report* figure cited secondhand, verify; market-size estimates differ by a factor of a hundred depending on definition). SCF can be a fair trade of a strong buyer's credit for a weak supplier's cash — or a way to borrow without calling it debt. Greensill Capital collapsed on 8 Mar 2021 after its insurer declined to renew cover expiring 1 Mar 2021 and Credit Suisse froze ~$10bn of funds (Finance: Greensill Capital); Americanas, a Brazilian retailer, disclosed ~R$20bn of "accounting inconsistencies" in Jan 2023, much of it supplier-finance debt booked as payables (reclassification added ~R$15.6bn to gross debt, reported). In response, US GAAP now requires buyers to disclose supplier-finance programmes (FASB ASU 2022-04, for fiscal years beginning after 15 Dec 2022, with a rollforward a year later), and IFRS followed (IAS 7/IFRS 7 amendments, from 1 Jan 2024). Underneath sits the cash conversion cycle (CCC) — receivable days plus inventory days minus payable days — which explains why Dell, Amazon and Costco could grow on their suppliers' money and why a retailer stuck with 2022's excess inventory, or an importer paying 2025–26 tariffs at the border, needed more cash at once. This section covers the instruments, SCF and its accounting, dynamic discounting, carrier factoring and quick pay, the CCC, trade credit insurance, tariffs as a working-capital shock, and the failures. A worked example computes a stylized CCC and SCF programme from both sides, and a checklist reviews a programme before signing.+ 2 exhibits19Trade Policy, Tariffs, Customs and Forced-Labour RulesA tariff is a tax on imports paid by the importer of record when goods enter the US, not by the exporting country — and between 2018 and 2026 it became the most volatile cost in American supply chains. The legal authority matters as much as the rate, because each authority can be imposed, stacked, excluded, struck down or refunded differently. The sequence: Section 301 tariffs on China (Lists 1–4A, Jul 2018–Sep 2019, 7.5–25%, raised on strategic goods by the 2024 four-year review); Section 232 "national security" tariffs on steel (25%) and aluminium (10%) from 23 Mar 2018, both raised to 50% from 4 Jun 2025 and extended in 2025–26 to autos, copper, trucks, timber and furniture, advanced chips and patented pharmaceuticals; IEEPA tariffs from Feb 2025 ("fentanyl" duties on Canada, Mexico and China; "reciprocal" duties on almost every country from 5 Apr 2025), which the Supreme Court held unlawful on 20 Feb 2026 (*Learning Resources v. Trump*, 6–3); a 10% Section 122 surcharge from 24 Feb to 24 Jul 2026 (a 15% increase was announced but never proclaimed); and from 24 Jul 2026 a new Section 301 action on 60 economies framed around forced-labour enforcement, at 10% or 12.5%, excluding goods already under Section 232 (USTR notice of action 23 Jul 2026; country tiers in the Federal Register annex). Around the tariffs sit the rest of customs: classification in the Harmonized Tariff Schedule (HTSUS), valuation, country of origin, the end of the $800 de minimis exemption (for China and Hong Kong 2 May 2025; suspended for all countries 29 Aug 2025 and kept after the ruling), antidumping and countervailing duties, the Uyghur Forced Labor Prevention Act (rebuttable presumption from 21 Jun 2022; Entity List expanded to 187 entities on 3 Aug 2026, plus three more on 29 Oct 2026), USMCA origin rules (the US declined to confirm the agreement's 16-year extension at the 1 Jul 2026 joint review, triggering annual reviews), refunds of IEEPA duties (CBP's CAPE portal from 20 Apr 2026), and Europe's carbon border tax. This section explains how a tariff is set and paid, the 2018–26 sequence authority by authority, refunds, de minimis, forced-labour rules, origin and AD/CVD, the EU, and the customs broker's role. A worked example compares duty mitigation by first sale, drawback and a foreign-trade zone; a checklist covers compliance. Rule 10 of this knowledge base applies: every rate below is given with its authority and date in force, and announced rates are not treated as rates in force. Nothing here is legal or customs advice.+ 2 exhibits20Cold Chain, Pharma and Food LogisticsThe cold chain is the part of the supply chain where a mistake is measured in degrees and hours and the product cannot be recovered: a pallet of frozen shrimp that thaws, a truckload of lettuce held too warm, or a shipment of vaccine that leaves its 2–8°C band is a write-off, and sometimes a safety recall. It is also the most capital- and energy-intensive part of warehousing. Temperature-controlled warehouses cost far more to build and run than ambient ones, and two listed US REITs dominate public ownership: Lineage, which listed on Nasdaq in Jul 2024 in the year's largest IPO (~$4.4bn raised at $78 a share, reported) and traded at ~$36 at the end of Oct 2026 (third-party quote, less than half the IPO price), and Americold. Pharma logistics is a higher-margin specialty that integrators and forwarders are buying into: UPS closed its acquisition of Andlauer Healthcare Group on 1 Nov 2025 (C$55.00 a share in cash, ~C$2.2bn, ~US$1.6bn). Rules are tightening and loosening at once. The FDA's food-traceability rule under FSMA section 204 was due on 20 Jan 2026; its compliance date moved to 20 Jul 2028, and Congress directed the FDA not to enforce it before then. Section 232 tariffs on patented pharmaceuticals and their active ingredients — up to 100%, from 31 Jul 2026 for 17 named companies and 29 Sep 2026 for other importers, 15% for the EU, Japan, Korea, Switzerland and Liechtenstein, with generics and biosimilars excluded for now — push drug makers towards US production and change what flows through pharma networks. This section explains temperature bands and units, cold-storage economics, reefer shipping and trucking, pharma logistics, COVID vaccine distribution (2020–21), food distribution and safety rules, the energy and labour exposure, and how to read the companies.21Labour, Safety, Sustainability and the Licence to OperateA supply chain runs on permission as well as on assets: from workers who agree to work under a contract, regulators who let trucks, trains and ships operate, juries who decide what a crash costs, communities that tolerate warehouses and ports, and customers and investors who want emissions counted. That permission is the licence to operate, and in 2022–26 it was renegotiated almost everywhere. US unions won some of their largest contracts in decades: the UPS–Teamsters agreement (ratified 22 Aug 2023, running to 31 Jul 2028), the East and Gulf Coast dockworkers' master contract after the 1–3 Oct 2024 ILA strike (ratified 25 Feb 2025, ~99% in favour, running 1 Oct 2024–30 Sep 2030, with a reported ~62% wage increase, $39 to $63 an hour at the top rate, and automation protections) and the West Coast ILWU agreement of 2023. Congress imposed a rail labour agreement in Dec 2022 to avert a national strike. Yellow closed on 30 Jul 2023 after a dispute with the same Teamsters union that had just signed with UPS. Safety failures cost railroads, shipowners and truckers their licence or their balance sheets: Norfolk Southern's East Palestine derailment (3 Feb 2023); the *Dali*'s collision with Baltimore's Key Bridge (26 Mar 2024; six road workers killed; Maryland's $2.25bn settlement with the ship's owner and manager in Apr 2026, reported); and "nuclear" truck-crash verdicts. On decarbonisation, the EU's emissions trading system covers shipping from 2024 (100% of covered 2026 emissions), FuelEU Maritime started on 1 Jan 2025, and the IMO's global Net-Zero Framework was not adopted: an extraordinary session voted on 17 Oct 2025 (57–49, 21 abstentions, reported) to adjourn adoption for a year after US opposition, with a resumed session reported for early Dec 2026. In US trucking, California lost its federal path for zero-emission truck mandates in 2025. This section covers unions and labour relations, warehouse work and injury scrutiny, the driver-shortage debate, safety regulators and litigation, decarbonisation rules and Scope 3 reporting, and how licence-to-operate risk shows up in a company's numbers.22Disruptions, Chokepoints and ResilienceSupply chains are built for the average week and judged in the worst one. Since 2020 the worst weeks have come often. The *Ever Given* blocked the Suez Canal for six days (23–29 Mar 2021); the COVID goods boom left more than a hundred container ships waiting off Los Angeles and Long Beach at the peak in early 2022 (reported) and pushed the Drewry World Container Index composite to a record $10,377/FEU in Sep 2021 (Drewry, 16–23 Sep 2021); Houthi attacks from 19 Nov 2023 sent most container lines around the Cape of Good Hope, a diversion still only partly reversed at Nov 2026; drought cut Panama Canal transits in 2023–24; the *Dali* brought down Baltimore's Key Bridge on 26 Mar 2024, closing the port's channel until 10 Jun 2024; the East and Gulf Coast ports struck for three days (1–3 Oct 2024); and the 2026 Iran war effectively halted traffic through the Strait of Hormuz from early Mar 2026, with Brent above $115/bbl in March and a reported high of $126.41/bbl on 30 Apr 2026 (Energy 19). Container rates on the busiest US lane reflect the compound effect: Drewry WCI Shanghai–Los Angeles ~$7,514/FEU on 29 Oct 2026, against ~$2,290/FEU a year earlier (reported; verify). Cyberattacks — Maersk's NotPetya losses (Jun 2017; $200–300m estimated by the company in Aug 2017, later ~$250–300m, reported), Expeditors (Feb 2022) and Blue Yonder (Nov 2024) — showed that a disruption can start in software. This section explains the kinds of disruption, the chokepoints that matter, the major cases since 2011, how disruptions propagate, and how resilience is priced and bought. Two companion files tell the Red Sea and Key Bridge cases and work through what a second-port contract and a second supplier are worth to a stylized US importer.+ 2 exhibits23Supply-Chain Failures, Bankruptcies and BustsThe supply-chain business destroys companies in a few recurring ways, and the same lessons are relearned each cycle. A 99-year-old LTL carrier, Yellow, stopped operating on 30 Jul 2023 with a terminal network its rivals then bought for ~$1.88bn in the first auction round (reported); its liquidating plan was confirmed on 17 Nov 2025 after a court held it liable for billions in multi-employer pension withdrawal liability (reported). A venture-funded digital broker once valued in the billions, Convoy, shut on 19 Oct 2023; Flexport bought its technology on 1 Nov 2023. The world's seventh-largest container line, Hanjin Shipping, filed for receivership on 31 Aug 2016, leaving ships and cargo stranded outside ports that would not let them in. Toys "R" Us filed for Chapter 11 on 18 Sep 2017, twelve years after a ~$6.6bn leveraged buyout, and liquidated its US stores in 2018. Brazil's Americanas disclosed ~R$20bn of "accounting inconsistencies" in Jan 2023, much of it supplier-finance debt booked as payables; a Rio court closed its judicial recovery on 19 Oct 2026 (reported). Around them sit the busts of a capital cycle — TuSimple, Getir and Gorillas, Peloton's inventory glut, Forward Air's Omni acquisition, the decline of Li & Fung, Target's Canadian exit — and, in 2026, a fresh wave of freight distress (STG Logistics' Chapter 11 on 12 Jan 2026, reported). This section classifies the failures by the factor of the flow equation they turned on, tells each case briefly, and asks what each cost and who paid: employees, pension funds, creditors, suppliers, shippers and taxpayers. Two companion files tell the Yellow and Convoy cases in full and give a warning-signs checklist.+ 2 exhibits24History, Strategy and Building Supply-Chain CompaniesMost of what supply-chain companies do today was invented to solve one of four problems: moving goods more cheaply (cost to serve), filling the network (density), keeping a promise customers can plan around (reliability), and financing assets that earn their keep only across a cycle (capital matched to the cycle). The history is a sequence of answers. Railroads and the mail-order catalogues of Montgomery Ward (1872) and Sears built the first national distribution networks; Malcom McLean's *Ideal X* sailed from Newark to Houston with containers on 26 Apr 1956 and made loading a ship a crane operation rather than a gang of longshoremen; deregulation in 1980 (the Motor Carrier Act and the Staggers Rail Act) let carriers set their own rates and routes; Toyota's production system made inventory a measure of waste; Walmart's distribution centres, satellite network and supplier data sharing (the Procter & Gamble partnership, 1987) turned logistics into a retail weapon; FedEx's first night from Memphis (17 Apr 1973) sold reliability as the product; China's WTO entry (11 Dec 2001) moved the factory floor across the Pacific; and e-commerce rebuilt the last mile around the doorstep. The strategic lessons repeat across the knowledge base: networks with density and reliability compound (Old Dominion); networks financed for the best year fail in the worst (Yellow, Hanjin, Toys "R" Us); venture capital can buy volume but not density (Convoy, shut 19 Oct 2023). This section tells the history briefly and then turns to strategy: asset-heavy versus asset-light, capital allocation through the freight cycle, roll-ups and break-ups, operator culture and talent, and the realistic start-up paths in software, brokerage, robotics and services, for founders in the US first and then Europe.

Supply Chain Research Companion · Part II

100 companies, 848 strategic moves

A profile of each company, followed by its defining moves year by year from 1862 to 2026: what was decided, why, how it was financed, and what happened next.

Browse all 100 →

Audiobook & narrative editions

154 hr 21 min of narration

Both volumes are rewritten as narrative editions that read straight through, in long-form prose instead of tables. The audiobook is narrated from those editions as chaptered M4B files that play in Apple Books, VLC, BookPlayer and most audiobook apps.

  • The Book15 hr 26 min
  • Companion Volume 1 - Industry Studies21 hr 15 min
  • Companion Volume 2 - Companies A to K58 hr 31 min
  • Companion Volume 3 - Companies K to Z and Timeline59 hr 9 min

Appendix C

Glossary: 77 terms

Read the full glossary →
3PL
Third-party logistics provider: a company that runs warehousing, fulfilment, transport management or other logistics for its customers, such as GXO, DHL Supply Chain or Ryder.
Adjusted gross profit
C.H. Robinson's term for its net revenue: gross revenue less purchased transportation and related services.
Alliance
A vessel-sharing agreement among container lines that pool ships on shared services but set prices separately; from February 2025 the main ones were Gemini, Ocean and Premier, with MSC sailing alone.
Backhaul and headhaul
The weaker and stronger directions of a trade lane; ships and trucks are priced and filled on the headhaul and often run light or empty on the backhaul.
Bill of lading
The document a carrier issues for cargo it has received, serving as a receipt, the evidence of the contract of carriage and, in ocean shipping, often a document of title.
BMC-84
The surety bond, of at least $75,000, that a US freight broker must file with the FMCSA; a BMC-85 trust fund is the alternative.
Break-bulk
In LTL trucking, a hub where freight from many terminals is unloaded, sorted and reloaded for its destinations; in shipping, cargo carried loose rather than in containers.
Bullwhip effect
The amplification of changes in demand as orders move up the supply chain from consumers to retailers, wholesalers, factories and carriers.

From the blog

Read before you buy

All 8 articles →

The Flow Equation

Learn the framework from the book. Test it against the companion.

Choose an edition

More in the series