To read a container shipping rate, you need five things: the unit (per TEU or per forty-foot FEU), the lane, whether it is a spot or contract price, which index or source it comes from, and the date. A headline such as "rates hit $7,500" means little without them. As of 29 October 2026, Drewry's World Container Index put the spot rate from Shanghai to Los Angeles at about $7,514 per FEU, against about $2,290 a year earlier (reported), but many large US importers paid annual contract rates that were quite different.
The 2021 boom is the reason these distinctions matter. In 2019 the spot price of moving a forty-foot box from China to the US West Coast was typically about $1,500–2,000. In September 2021 the same box cost more than $20,000 at the peak on the Freightos Baltic Index China–US West Coast lane (reported), with premiums for guaranteed space on top. Nothing about the ships had changed. A shipper on a contract and a shipper buying spot paid wildly different prices for the same slot on the same vessel, if the contract shipper's box was loaded at all.
Step 1: Get the unit right
| Term | Meaning | Use |
|---|---|---|
| TEU | Twenty-foot equivalent unit, one 20-ft container | Ship capacity, fleet size, port throughput |
| FEU | Forty-foot container, equal to 2 TEU | Most freight indices quote $ per FEU; most US retail imports move in 40-ft high cubes |
| Slot cost | Cost of running a ship divided by its slots | Falls with ship size; rises when ships sail part-empty |
| Bunker | Ship fuel, priced per metric ton | Passed to shippers through surcharges with a lag |
Never mix TEU and FEU. $2,000 per FEU is $1,000 per TEU. The Shanghai Containerized Freight Index quotes some lanes per TEU and others per FEU, so check each lane before comparing.
Step 2: Know which index you are reading
| Index | Publisher | What it measures |
|---|---|---|
| World Container Index (WCI) | Drewry | Weekly spot rates for 40-ft containers on eight East–West lanes, plus a composite; published Thursdays |
| Shanghai Containerized Freight Index (SCFI) | Shanghai Shipping Exchange | Weekly spot rates from Shanghai to 13+ destinations, in mixed units |
| Freightos Baltic Index (FBX) | Freightos with the Baltic Exchange | Daily and weekly spot rates from booking data; 12 lanes and a global composite |
| Xeneta | Xeneta | Crowd-sourced contract and spot data from shippers, used for benchmarking |
| China Containerized Freight Index (CCFI) | Shanghai Shipping Exchange | Contract-weighted export index that moves less than the SCFI |
The indices disagree with one another because they measure different things. A composite averages lanes. A lane index shows one trade. A contract-weighted index moves slowly by design.
Step 3: Separate spot from contract
The rate in the news is the spot rate: the marginal price for a box booked now. Most cargo of large shippers moves under annual service contracts filed with the Federal Maritime Commission. The transpacific contract season runs to 1 May; Asia–Europe contracts often start on 1 January or run quarterly. A contract specifies a rate per FEU by lane, a minimum quantity commitment, surcharges and free time at terminals.
Because most of a carrier's revenue comes from contracts signed months earlier, its reported average revenue per container lags the spot indices by one to three quarters, up and down. If a carrier's "average rate rose 30%", ask whether that is its own revenue per FEU, which is mostly contract, or a spot index.
Before 2022, both sides treated contracts as options. Shippers shipped less than their minimum commitments when spot fell below contract. Carriers "rolled" contract cargo, leaving it on the quay, in favor of spot cargo that paid several times as much in 2021. After the boom, more contracts were tied to an index, so the price floats within agreed bounds. A fixed rate is only worth what the counterparty will honor in a squeeze. Chapter 13 on contracts and the freight market covers that lesson in depth.
Step 4: Add the surcharges and the land side
The ocean rate is only part of the bill. Contracts and invoices add a bunker adjustment factor for fuel, peak-season surcharges, port-congestion and war-risk charges, canal surcharges and, on European trades, emissions surcharges for the EU Emissions Trading System, which covers 100% of in-scope emissions from 2026. Then come terminal handling, customs brokerage, drayage to a warehouse, chassis rental, and demurrage and detention if a box stays too long in the terminal or comes back late.
Fuel shows how the lag works. Singapore very-low-sulfur fuel oil was reported at about $793 per ton on 1 October 2026 and about $998 per ton on 30 October (Ship & Bunker and ENGINE, reported), following the oil shock of the 2026 Hormuz crisis. Carriers pass fuel through by surcharge a month or a quarter later, so a fuel spike squeezes their margins before it lifts shippers' bills.
Step 5: Convert the rate into cost per unit
A container rate matters to an importer only as a cost per item sold. The book's Chapter 3 on who pays to move a box traces a stylized folding patio chair, 600 to a container, sold online for $59.99.
| Cost per chair (stylized) | $2,000/FEU, 40 days | $20,000/FEU, 90 days |
|---|---|---|
| Factory price | $14.00 | $14.00 |
| Ocean freight | $3.33 | $33.33 |
| Inventory carrying cost in transit | $0.58 | $3.15 |
| Port, drayage, duty, fees, warehouse, parcel and returns | $17.20 | $17.20 |
| Left for the retailer's overheads and profit | $24.88 (41%) | −$7.69 (−13%) |
At the ordinary rate the ocean leg is under 6% of the price. At a rate close to the 2021 peak, freight costs more than twice what the factory charged and every chair loses money before overhead. A pair of earbuds packed 20,000 to a container would have seen freight rise from about 10 cents to about a dollar a unit. The spike fell hardest on bulky, low-value goods and on importers with no contract to fall back on. Our guide on how to calculate landed cost extends this to tariffs and sourcing countries.
What happened to shipping rates in 2021?
In mid-2020 US consumers moved spending from services to goods while stimulus payments arrived. Imports surged just as ports, warehouses, truckers and railroads ran short of labor and space. The system jammed from the land side inward: full warehouses left boxes in terminal yards, chassis were stuck under them, and empties could not be returned. Ships waiting off Los Angeles and Long Beach peaked at about 109 on 9 January 2022 (Marine Exchange of Southern California, reported). The Ever Given blocked the Suez Canal from 23 to 29 March 2021. The Drewry WCI composite peaked at about $10,377 per FEU in September 2021, against about $1,400–1,500 in 2019 (reported).
The liner industry earned more in 2021–22 than in the previous several decades combined, by most estimates. Carriers spent it on new ships, logistics acquisitions, terminals and dividends. Large retailers such as Walmart, Home Depot, Costco and IKEA chartered their own ships (reported), an expensive insurance policy largely abandoned by 2023. Congress responded with the Ocean Shipping Reform Act, signed on 16 June 2022, which shifted the burden of proof on detention and demurrage charges to carriers. The ports side of that story is in the industry study of ports, terminals and canals.
Why are shipping rates so volatile?
Container shipping sells a nearly undifferentiated service with very high fixed costs. A carrier's profit is mostly earned when headhaul ships are between about 80% and 100% full. Below that, prices fall toward marginal cost. Above it, rates spike because there is nothing left to sell.
| Phase | Years | Rates (indicative) | What drove it |
|---|---|---|---|
| Decade of oversupply | 2010–19 | Mostly low | Ultra-large ships; rate wars; Hanjin's receivership in 2016 |
| Shortage and windfall | 2020–22 | 5–10× pre-pandemic | Goods demand, congestion, Ever Given |
| Reset | 2023 | Near or below cost on some lanes | Demand fell, congestion cleared, new ships delivered |
| Diversion | 2024–25 | Elevated, volatile | Red Sea attacks sent most Asia–Europe ships around the Cape |
| Shock and overhang | 2026 | High on the transpacific after the Hormuz crisis | Partial Suez return; Hormuz; record orderbook |
The 2026 jump on Shanghai–Los Angeles, from about $2,300 to about $7,500 per FEU in a year, is a shock story, not a demand story: higher fuel prices and disrupted Gulf and Indian Ocean routes after strikes on Iran began on 28 February 2026. Meanwhile the orderbook reached about 16.2 million TEU, about 46.5% of the existing fleet, in October 2026 (Linerlytica via Seatrade, reported). The carriers that entered past downturns with high debt and chartered ships failed or were absorbed, Hanjin most dramatically. Those with cash bought capacity cheaply.
A checklist for reading any rate headline
| Claim | What to ask |
|---|---|
| "Rates are $3,000" | Per TEU or FEU? Spot or contract? Which index, lane and week? Including surcharges? |
| "Average freight rate up 30%" | A carrier's revenue per FEU (mostly contract, lagging) or a spot index? |
| "Carrier X earned $10 billion" | EBITDA, EBIT or net income? Ocean only, or including logistics and terminals? |
| "Schedule reliability of 90%" | Whose measure, which month, and within how many days of schedule? |
| "Orderbook at 46% of fleet" | Delivered over how many years? Net of expected scrapping? |
Shipping rates and the flow equation
The Flow Equation argues that value depends on four factors that multiply: cost to serve, density, reliability and capital matched to the cycle. For shippers, the 2021 spike turned on cost to serve: a product that worked at $2,000 per FEU might not work at any price customers would pay at $20,000. For carriers it was the reverse trap. A boom-year rate is a scarcity rent, not a cost to serve, and fleets ordered as if it would last test the fourth factor when it ends. Maersk's attempt to leave the cycle through logistics and MSC's bet on owning the most ships are the two strategies the book compares. The full industry study is ocean container shipping and carrier alliances, and the wider industry is mapped in our guide to the logistics industry business model.
The takeaway
A container rate is a number with five qualifiers, and most misreadings come from dropping one: unit, lane, spot or contract, index and date. Spot indices are the marginal price, while most large shippers pay contracts that lag them and that both sides honor only when it suits them. The rate matters to a business only as a cost per unit sold, which is why bulky, low-value goods suffered most in 2021. Chapter 5 of The Flow Equation explains the economics of ocean shipping behind these swings.
Frequently asked questions
How much does it cost to ship a 40-foot container from China to the US?+
It depends on the date and the contract. On Drewry's World Container Index, the Shanghai–Los Angeles spot rate was about $7,514 per forty-foot container on 29 October 2026, against about $2,290 a year earlier (reported). Large importers on annual contracts often pay something quite different from spot.
Why did container shipping rates rise so much in 2021?+
US consumers switched spending from services to goods just as ports, warehouses and trucking ran short of labor and space. Ships queued, containers were stuck inland and effective capacity fell. The Drewry WCI composite peaked at about $10,377 per FEU in September 2021, against about $1,400–1,500 in 2019 (reported).
What is the difference between TEU and FEU?+
A TEU is one twenty-foot container; an FEU is one forty-foot container, equal to two TEU. Most indices quote US-bound rates per FEU, while ship capacity and port volumes are counted in TEU, so $2,000 per FEU is $1,000 per TEU.
Will container shipping rates go down?+
No one can say with confidence, and this is not a forecast. The research notes a record orderbook of about 16.2 million TEU, about 46.5% of the existing fleet, in October 2026, which points to more capacity, against recurring shocks such as the Red Sea diversions and the 2026 Hormuz crisis that absorb ships.
Go deeper in The Flow Equation
Chapters
Industry studies
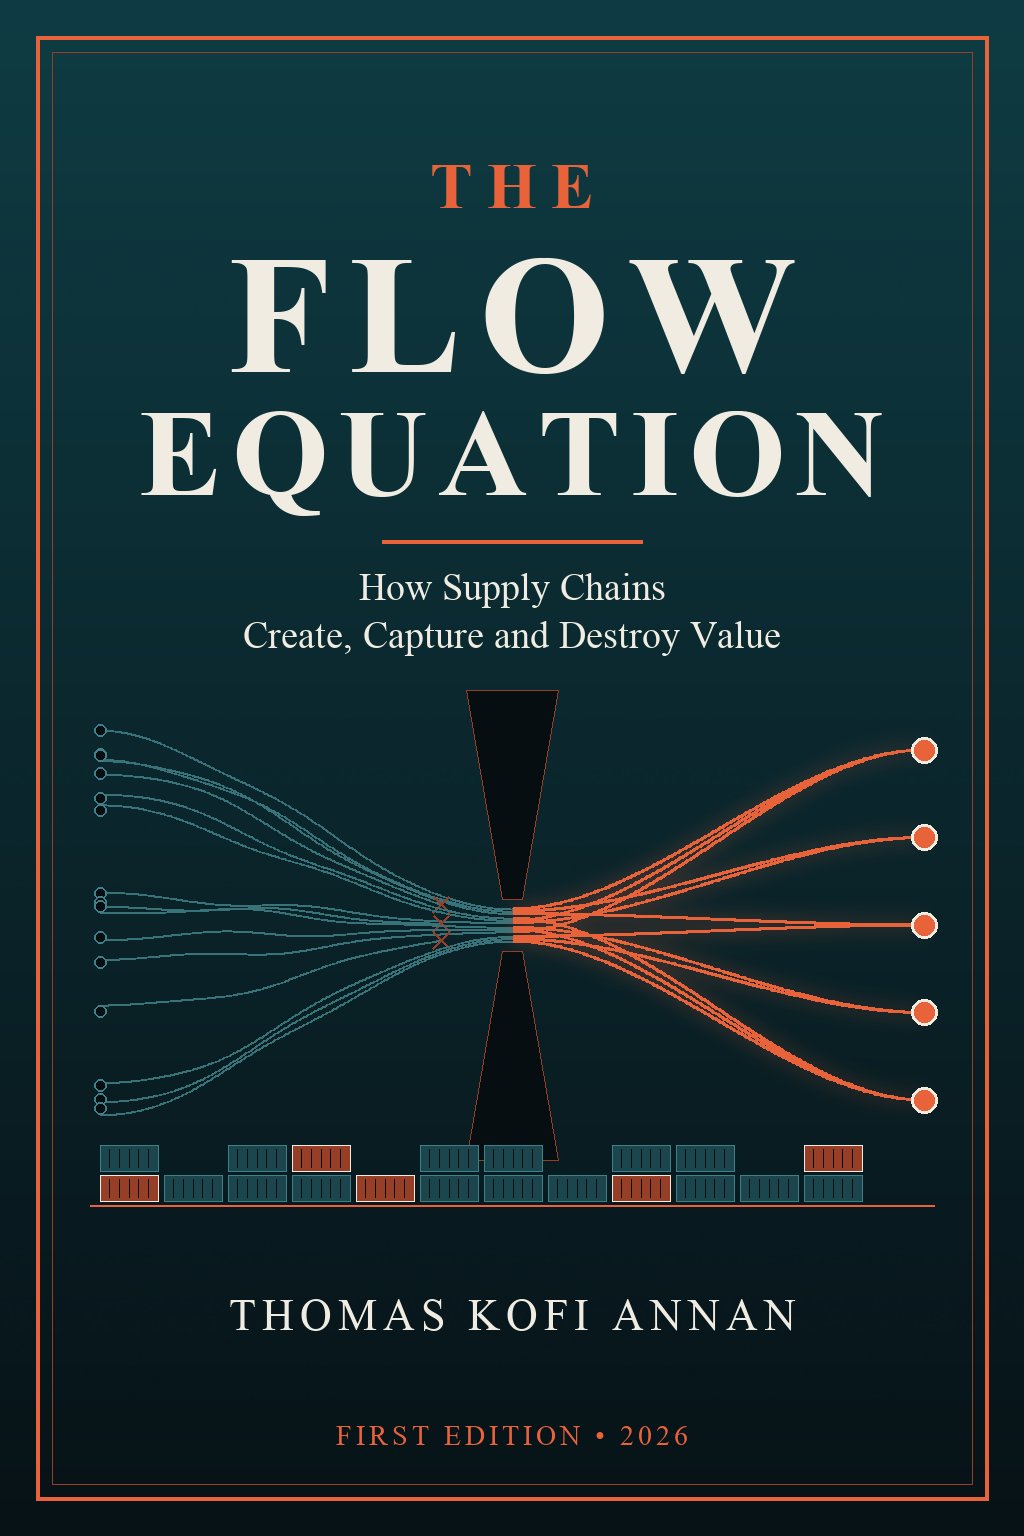
From the research behind The Flow Equation
How Supply Chains Create, Capture and Destroy Value
25 chapters, 24 industry studies, 100 companies and 848 strategic moves.
See the bookEducational content, not investment, legal, tax, medical or engineering advice. Figures marked “reported” come from filings and published sources that have not been independently audited.